Analyzing the Quality of White and Red Wine
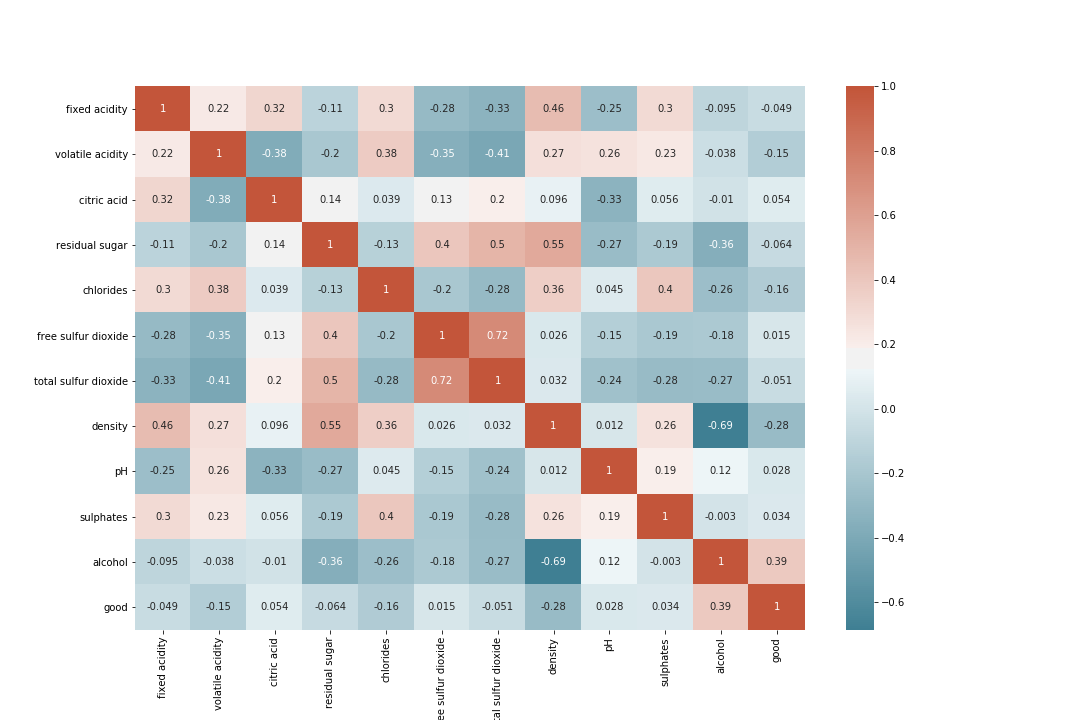
This correlation matrix gives a better understanding of the relationships between various variables for white and red wine. As shown below, the darker the square, the greater the corelation between variables. Orange squares show a positive correlation and blue squares show a negaitve correlation.