Home
Resources
Wine Quality: Both Red and White wine data.
Visualizations
Wine Quality
Correlation Matrix
Wine Quality Aspects
Wine Quality Importances
Machine Learning
How Good is Your Wine?
K Nearest Neighbors
Residual Plot
Scaling Normalization
Scatter Plot
Pair Plot
Contact Us
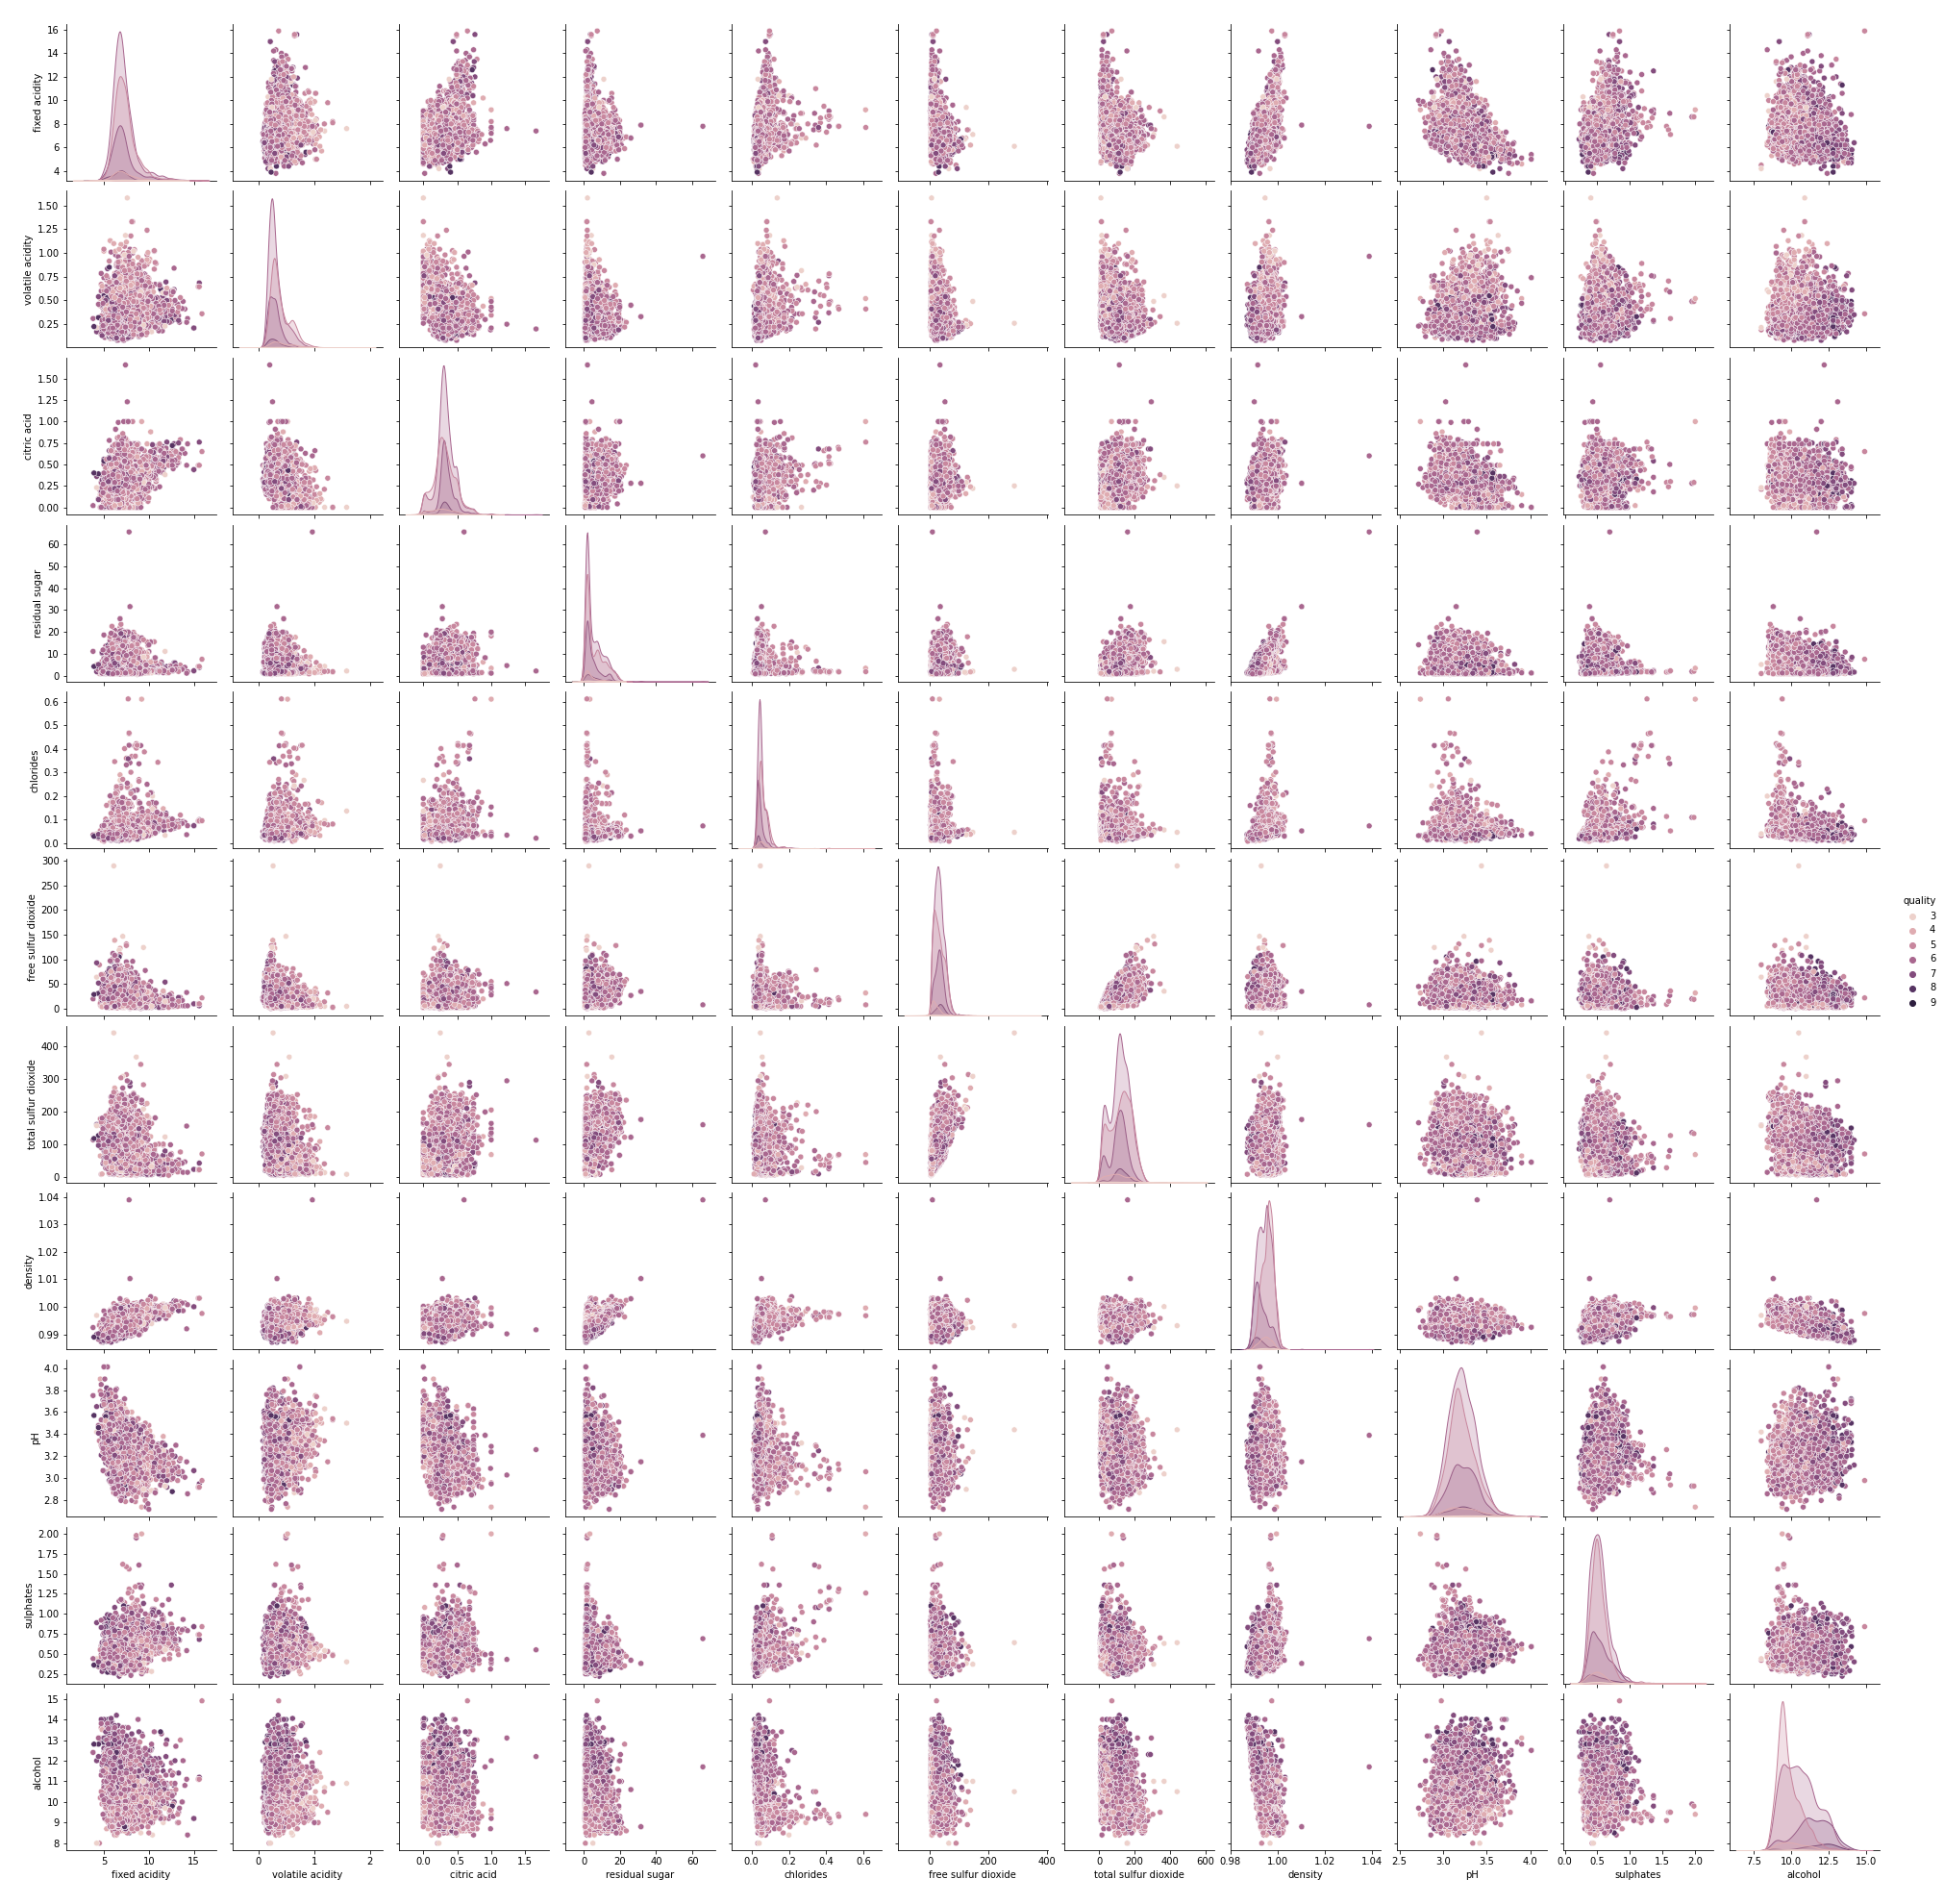
Pair Plots
Pair plots are a really simple way to quickly and easily visualize the relationships between each variable by producing a matrix of relationships between each feature in our data.